

On the Change and Effect of Urbanization on the Ecological Footprint of Residents' Food Consumption in China
-
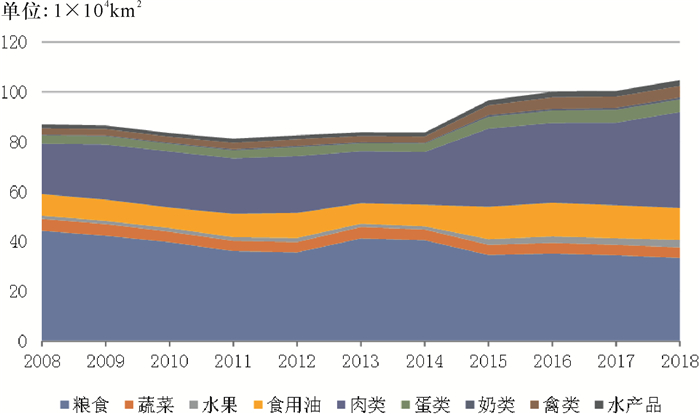
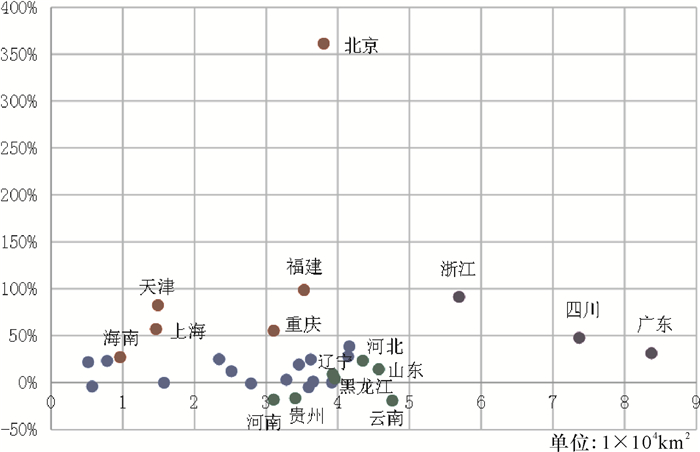
摘要: 对2008—2018年全国31个省份的居民食物消费生态足迹进行分类计算,运用Tapio弹性脱钩指数模型与固定效应模型分析城镇化水平对居民食物消费生态足迹的影响效应。研究发现:居民食物消费生态足迹总体呈上升趋势,2015年肉类消费生态足迹明显上升并首次成为居民食物消费生态足迹最主要的构成类别;不同省份的居民食物消费生态足迹呈集中分布趋势且增长较快;全国总体城镇化水平与居民食物消费生态足迹处于弱脱钩状态,不同省份脱钩状态差异较大;人口城镇化对居民食物消费生态足迹存在负向影响,经济城镇化、社会城镇化对居民食物消费生态足迹均存在正向影响,空间城镇化对居民食物消费生态足迹不存在显著影响。建议从提高人口城镇化率、发挥产业集聚效应、提高土地利用率及居民环保意识等方面,促进城市经济增长、社会发展和环境的改善。Abstract: Based on calculation of the ecological footprint of food consumption of residents from 31 provinces in China from 2008 to 2018, the Tapio elastic decoupling index model and the fixed effect model are employed to analyze the effect of urbanization on the ecological footprint of food consumption. The results show that the ecological footprint of food consumption is on the rise, so is the ecological footprint of meat consumption in 2015, being the most important component category of the ecological footprint of food consumption; the ecological footprint of residents' food consumption in different provinces shows a concentrated distribution trend and increases rapidly; the overall level of urbanization and ecological footprint of residents' food consumption in China are in a weak decoupling state, while the decoupling state is quite different between provinces; population urbanization has a negative impact on the ecological footprint of residents' food consumption, while economic urbanization and social urbanization have a positive impact on the ecological footprint of residents' food consumption, while spatial urbanization has no significant impact on the ecological footprint of residents' food consumption. It is suggested that the urban economic growth, social development and the improvement of ecological environment should be promoted by increasing the rate of population urbanization, exerting the effect of industrial agglomeration, increasing land utilization efficiency and raising the residents' consciousness of environmental protection.
-
Key words:
- food consumption /
- ecological footprint /
- urbanization /
- urbanization rate /
- land utilization efficiency /
- fixed effect /
- resident
-
表 1 环境压力与经济增长脱钩状态判别表
脱钩状态 %ΔECt+1 %ΔIOt+1 脱钩弹性指数 含义 评价 强负脱钩 < 0 >0 εt+1 < 0 经济衰退,环境压力变大 最差 弱负脱钩 < 0 < 0 0 < εt+1 < 0.8 经济衰退,环境压力缓慢变大 很差 扩张性负脱钩 >0 >0 εt+1>1.2 经济缓慢增长,环境压力迅速变大 差 衰退性连接 < 0 < 0 0.8 < εt+1 < 1.2 经济衰退,环境压力同步变小 较差 扩张性连接 >0 >0 0.8 < εt+1 < 1.2 经济增长,环境压力同步变大 一般 衰退性脱钩 < 0 < 0 εt+1>1.2 经济衰退,环境压力迅速变小 较好 弱脱钩 >0 >0 0 < εt+1 < 0.8 经济增长,环境压力缓慢变大 好 强脱钩 >0 < 0 εt+1 < 0 经济增长,环境压力变小 最好  下载: 导出CSV
表 2 居民食物消费生态足迹与城镇化水平脱钩状态判别表
脱钩状态 %ΔFPt+1 %ΔURt+1 脱钩弹性指数 含义 评价 强负脱钩 < 0 >0 εt+1 < 0 城镇化衰退,生态足迹增大 最差 弱负脱钩 < 0 < 0 0 < εt+1 < 0.8 城镇化衰退,生态足迹缓慢增大 很差 扩张性负脱钩 >0 >0 εt+1>1.2 城镇化缓慢增长,生态足迹迅速增大 差 衰退性连接 < 0 < 0 0.8 < εt+1 < 1.2 城镇化衰退,生态足迹同步减少 较差 扩张性连接 >0 >0 0.8 < εt+1 < 1.2 城镇化增长,生态足迹同步增大 一般 衰退性脱钩 < 0 < 0 εt+1>1.2 城镇化衰退,生态足迹迅速减少 较好 弱脱钩 >0 >0 0 < εt+1 < 0.8 城镇化增长,生态足迹缓慢增大 好 强脱钩 >0 < 0 εt+1 < 0 城镇化增长,生态足迹减少 最好
下载: 导出CSV
表 3 2008-2018年全国总体脱钩状态判别表
年份 ΔFP ΔUR 脱钩指数 脱钩状态 2009 -0.003 8 0.176 3 -0.021 7 强脱钩 2010 -0.035 9 0.145 4 -0.247 1 强脱钩 2011 -0.027 8 0.142 3 -0.195 4 强脱钩 2012 0.017 7 0.120 0 0.147 9 弱脱钩 2013 0.013 8 0.130 4 0.106 0 弱脱钩 2014 -0.001 4 0.100 8 -0.013 6 强脱钩 2015 0.155 5 0.088 0 1.767 2 扩张性负脱钩 2016 0.035 3 0.086 3 0.409 4 弱脱钩 2017 0.003 6 0.087 8 0.040 6 弱脱钩 2018 0.043 7 0.034 8 1.256 2 扩张性负脱钩
下载: 导出CSV
表 4 2008-2018年分周期全国总体脱钩状态判别表
年份 指标 ΔFP ΔUR 脱钩指数 脱钩状态 2009-2011 -0.066 3 0.539 1 -0.123 0 强脱钩 2012-2015 0.190 6 0.516 2 0.369 3 弱脱钩 2016-2018 0.084 4 0.222 7 0.378 9 弱脱钩
下载: 导出CSV
表 5 2008-2018年分周期各省份脱钩指数与脱钩状态表
省份 脱钩状态 2009-2011年 2012-2015年 2016-2018年 北京 扩张性负脱钩 扩张性负脱钩 扩张性负脱钩 天津 弱脱钩 扩张性负脱钩 扩张性连接 河北 弱脱钩 弱脱钩 弱脱钩 山西 强脱钩 强脱钩 弱脱钩 内蒙古 强脱钩 弱脱钩 强脱钩 辽宁 强脱钩 扩张性负脱钩 衰退性脱钩 吉林 强脱钩 弱脱钩 强负脱钩 黑龙江 强脱钩 扩张性负脱钩 弱脱钩 上海 扩张性连接 弱脱钩 扩张性负脱钩 江苏 强脱钩 弱脱钩 强脱钩 浙江 强脱钩 扩张性负脱钩 扩张性负脱钩 安徽 强脱钩 扩张性连接 弱脱钩 福建 弱脱钩 弱脱钩 扩张性负脱钩 江西 强脱钩 弱脱钩 弱脱钩 山东 强脱钩 弱脱钩 弱脱钩 河南 强脱钩 弱脱钩 弱脱钩 湖北 强脱钩 扩张性连接 强脱钩 湖南 强脱钩 扩张性连接 弱脱钩 广东 弱脱钩 弱脱钩 扩张性连接 广西 强脱钩 扩张性连接 弱脱钩 海南 强脱钩 弱脱钩 扩张性负脱钩 重庆 强脱钩 扩张性连接 扩张性连接 四川 强脱钩 扩张性负脱钩 弱脱钩 贵州 弱脱钩 强脱钩 强脱钩 云南 强脱钩 强脱钩 弱脱钩 西藏 弱负脱钩 扩张性连接 强脱钩 陕西 强脱钩 扩张性连接 弱脱钩 甘肃 强脱钩 弱脱钩 强负脱钩 青海 强脱钩 弱脱钩 扩张性负脱钩 宁夏 强脱钩 强脱钩 弱脱钩 新疆 弱脱钩 强负脱钩 强脱钩
下载: 导出CSV
表 6 单位根检验结果
变量 LLC检验 IPS检验 结论 lnFP 0.000 0*** 0.470 6 非平稳 lnEUR 0.000 0*** 0.998 4 非平稳 lnPUR 1.000 0 0.000 0*** 非平稳 lnRUR 0.000 0*** 0.096 0 非平稳 lnSUR 0.013 6** 1.000 0 非平稳 lnCDR 0.000 0*** 0.087 0 非平稳 lnFDI 0.000 0*** 0.998 8 非平稳 lnPGDP 0.000 0*** 0.971 6 非平稳 ΔlnFP 0.000 0*** 0.000 0*** 平稳 ΔlnEUR 0.000 0*** 0.003 2*** 平稳 ΔlnPUR 0.000 0*** 0.000 0*** 平稳 ΔlnRUR 0.000 0*** 0.000 0*** 平稳 ΔlnSUR 0.000 0*** 0.000 6*** 平稳 ΔlnCDR 0.000 0*** 0.000 0*** 平稳 ΔlnFDI 0.000 0*** 0.000 2*** 平稳 ΔlnPGDP 0.000 0*** 0.000 1*** 平稳 注:**、***分别表示在5%、1%水平下不存在单位根。
下载: 导出CSV
表 7 协整检验结果
变量 Statistic p-value Modified Dickey-Fuller t -1.389 9 0.082 3 Dickey-Fuller t -2.545 2 0.005 5 Augmented Dickey-Fuller t -2.016 8 0.021 9 Unadjusted modified Dickey-Fuller t -2.455 2 0.000 7 Unadjusted Dickey-Fuller t -3.136 3 0.000 9
下载: 导出CSV
表 8 模型估计结果
变量 Coef. Std.Err. t P lnEUR 1.178 979*** 0.186 442 6.32 0.000 lnPUR -1.509 15*** 0.239 068 -6.31 0.000 lnRUR 0.033 347 0.048 221 0.69 0.490 lnSUR 0.237 374** 0.103 098 2.30 0.022 lnCDR -0.026 98 0.047 376 -0.57 0.569 lnFDI 0.172 501*** 0.028 106 6.14 0.000 lnPGDP -1.139 51*** 0.223 634 -5.1 0.000 _cons 9.219 023*** 0.714 37 12.91 0.000 R2 0.419 3 F 31.25 Prob 0.000 0 注:**、***分别表示系数通过了5%、1%水平的显著性检验。
下载: 导出CSV
-
[1] LI Y, WANG L E, CHENG S. Spatiotemporal variability in urban HORECA food consumption and its ecological footprint in China[J]. Sci. Total. Environment, 2019, 687: 1232-1244. doi: 10.1016/j.scitotenv.2019.06.148 [2] VITOUSEK P M, EHRLICH P R, EHRLICH A H, et al. Human appropriation of the products of photosynthesis[J]. Bioscience, 1986, 36: 368-373. doi: 10.2307/1310258 [3] WACKERNAGEL M, REES W. Our ecological footprint: reducing the impact on the earth[M]. Canada: New Society Publishers, 1996. [4] 向书坚, 柴士改. 生态足迹若干不足、修正与完善以及应用拓展[J]. 资源科学, 2013(5): 1051-1058. https://www.cnki.com.cn/Article/CJFDTOTAL-ZRZY201305020.htm [5] 曹淑艳, 谢高地. 城镇居民食物消费的生态足迹及生态文明程度评价[J]. 自然资源学报, 2016(31): 1073-1085. https://www.cnki.com.cn/Article/CJFDTOTAL-ZRZX201607001.htm [6] VOLODYA E, YEO M J, KIM Y P. Trends of ecological footprints and policy direction for sustainable development in Mongolia: a case study[J]. Sustainability, 2018, 10(11): 4026. doi: 10.3390/su10114026 [7] 张红侠, 曾科, 李睿康. 基于生态压力指数的商洛市土地生态安全研究[J]. 干旱地区农业研究, 2014(2): 246. https://www.cnki.com.cn/Article/CJFDTOTAL-GHDQ201402041.htm [8] 张翠娟. 基于生态足迹模型的河南省农业生态承载力动态评价[J]. 中国农业资源与区划, 2020(2): 246. https://www.cnki.com.cn/Article/CJFDTOTAL-ZGNZ202002037.htm [9] UDEMBA E N. A sustainable study of economic growth and development amidst ecological footprint: new insight from Nigerian perspective[J]. Science of the Total Environment, 2020, 732: 139270. doi: 10.1016/j.scitotenv.2020.139270 [10] MEIDAD KISSINGER. Approaches for calculating a nation's food ecological footprint——the case of Canada[J]. Ecological Indicators, 2013, 24: 366-374. doi: 10.1016/j.ecolind.2012.06.023 [11] MENCONI M E, STELLA G, GROHMANN D. Revisiting the food component of the ecological footprint indicator for autonomous rural settlement models in Central Italy[J]. Ecological Indicators, 2013, 34: 580-589. doi: 10.1016/j.ecolind.2013.06.011 [12] ZSÓFIFIA VETÖNÉ MÓZNER. Sustainability and consumption structure: environmental impacts of food consumption clusters: a case study for Hungary[J]. International Journal of Consumer Studies, 2014, 38: 529-539. doi: 10.1111/ijcs.12130 [13] ALESSANDRO GALLI, KATSUNORI IHA, MARTIN HALLE, et al. Mediterranean countries' food consumption and sourcing patterns: an ecological footprint viewpoint[J]. Science of the Total Environment, 2017, 578: 383-391. doi: 10.1016/j.scitotenv.2016.10.191 [14] GUOBAO SONG, LI M J, SEMAKULA H M, et al. Food consumption and waste and the embedded carbon, water and ecological footprints of households in China[J]. Science of the Total Environment, 2015, 529: 191-197. doi: 10.1016/j.scitotenv.2015.05.068 [15] LIN ZHEN, BINGZHEN DU. Ecological footprint analysis based on changing food consumption in a poorly developed area of China[J]. Sustainability, 2017, 9: 1323. doi: 10.3390/su9081323 [16] 郭华, 蔡建明, 杨振山. 城市食物生态足迹的测算模型及实证分析[J]. 自然资源学报, 2013(3): 417-425. https://www.cnki.com.cn/Article/CJFDTOTAL-ZRZX201303008.htm [17] 陈文辉. 北京市食物消费的生态足迹核算与空间扩展研究[D]. 北京: 中国科学院大学, 2015. [18] 杨莉, 余倩倩. 海南省城乡居民消费的环境影响评估和环境公平性分析[J]. 江苏农业学报, 2019(5): 1232-1239. doi: 10.3969/j.issn.1000-4440.2019.05.033 [19] 李芳林. 城市居民消费的环境效应及其应对策略研究[D]. 镇江: 江苏大学, 2019. [20] 赵正, 宁静, 周非飞. 基于生态足迹模型的资源型城市生态承载力评价: 以黑龙江省大庆市为例[J]. 水土保持通报, 2019(39): 281-287. https://www.cnki.com.cn/Article/CJFDTOTAL-STTB201902044.htm [21] 王海平, 陈志峰, 曹红亮. 城镇化背景下福建城乡居民食物消费转型及其生态足迹[J]. 江苏农业科学, 2019(22): 315-321. https://www.cnki.com.cn/Article/CJFDTOTAL-JSNY201922072.htm [22] SUBIR BAIRAGI, SAMARENDU MOHANTY, SAMPRITI BARUAH, et al. Changing food consumption patterns in rural and urban Vietnam: implications for a future food supply system[J]. Australian Journal of Agricultural and Resource Economics, 2020, 64: 750-775. doi: 10.1111/1467-8489.12363 [23] PETER WARR. Urbanization and the demand for food[J]. Bulletin of Indonesian Economic Studies, 2020, 56: 43-86. doi: 10.1080/00074918.2020.1742285 [24] 邓婷鹤, 毕洁颖, 聂凤英. 城镇化与老龄化对未来食物消费需求的影响研究[J]. 城市发展研究, 2018(25): 7-14, 136. https://www.cnki.com.cn/Article/CJFDTOTAL-CSFY201812025.htm [25] BATTERSBY J. Hungry cities: a critical review of urban food security research in sub-Saharan African cities[J]. Geography Compass, 2013, 7: 452-463. doi: 10.1111/gec3.12053 [26] SYLVIA SZABO. Urbanization and food insecurity risks: assessing the role of human development[J]. Oxford Development Studies, 2016, 44: 28-48. doi: 10.1080/13600818.2015.1067292 [27] 张少春, 闵师, 马瑞. 城市化、食物消费转型及其生态环境影响[J]. 城市发展研究, 2018(25): 13-20. https://www.cnki.com.cn/Article/CJFDTOTAL-CSFY201803003.htm [28] 高庆彦, 潘玉君. 我国省域城镇化水平与资源环境压力脱钩的时空分析[J]. 生态经济, 2020(1): 99-105, 171. https://www.cnki.com.cn/Article/CJFDTOTAL-STJJ202001018.htm [29] 杨钧. 城镇化对环境治理绩效的影响——省级面板数据的实证研究[J]. 中国行政管理, 2016(4): 103-109. doi: 10.3782/j.issn.1006-0863.2016.04.15 [30] 梁超. 环境约束下我国城镇化效率及其影响因素实证研究[J]. 重庆: 重庆大学, 2013. https://cdmd.cnki.com.cn/Article/CDMD-10611-1013043977.htm [31] GERBENS-LEENES W, NONHEBEL S. Food and land use: the influence of consumption patterns on the use of agricultural resources[J]. Appetite, 2005, 45(1): 24-31. doi: 10.1016/j.appet.2005.01.011 [32] 吴燕, 王效科, 逯非. 北京市居民食物消耗生态足迹和水足迹[J]. 资源科学, 2011(6): 1145-1152. https://www.cnki.com.cn/Article/CJFDTOTAL-ZRZY201106021.htm [33] 吴德存. 城镇化进程中江苏省生态足迹时空演变与影响机理研究[D]. 徐州: 中国矿业大学, 2017. [34] 刘兴荣, 秦趣, 张勇荣. 人口素质对喀斯特山区生态环境演变的作用机制分析——以贵州省六盘水市为例[J]. 西北师范大学学报: 自然科学版, 2016(5): 101-106. https://www.cnki.com.cn/Article/CJFDTOTAL-XBSF201605022.htm [35] 张丹, 成升魁, 高利伟, 等. 城市餐饮业食物浪费的生态足迹——以北京市为例[J]. 资源科学, 2016(1): 10-18. https://www.cnki.com.cn/Article/CJFDTOTAL-ZRZY201601002.htm [36] OECD. Decoupling: a conceptual overview[R]. Paris: OECD, 2001. [37] ZAHOOR AHMED, BIN ZHANG, MICHAEL CARY. Linking economic globalization, economic growth, financial development, and ecological footprint: evidence from symmetric and asymmetric ARDL[J]. Ecological Indicators, 2021, 121: 15-21. http://www.sciencedirect.com/science/article/pii/S1470160X20309997 [38] DAVIDMAC O EKEOCHA. Urbanization, inequality, economic development and ecological footprint: searching for turning points and regional homogeneity in Africa[J]. Journal of Cleaner Production, 2020, 291: 125-244. http://www.sciencedirect.com/science/article/pii/S0959652620352884 [39] 黄宝荣, 崔书红, 李颖明. 中国2000—2010年生态足迹变化特征及影响因素[J]. 环境科学, 2016(2): 420-426. https://www.cnki.com.cn/Article/CJFDTOTAL-HJKZ201602005.htm [40] 程钰, 尹建中, 王建事. 黄河三角洲地区自然资本动态演变与影响因素研究[J]. 中国人口·资源与环境, 2019(4): 127-136. https://www.cnki.com.cn/Article/CJFDTOTAL-ZGRZ201904014.htm [41] 徐辉, 杨烨. 人口和产业集聚对环境污染的影响——以中国的100个城市为例[J]. 城市问题, 2017(1): 53-60. https://www.cnki.com.cn/Article/CJFDTOTAL-CSWT201701007.htm [42] 王庆娟. 城市人口规模对环境污染的门槛效应研究[D]. 北京: 首都经济贸易大学, 2014. [43] 钟晓敏, 童幼雏. 农业转移人口市民化成本分析: 基于浙江省数据的估算[J]. 财经论丛, 2019(12): 13-23. doi: 10.3969/j.issn.1004-4892.2019.12.002 [44] 康乾. 外商直接投资对中国环境污染的影响——基于碳排放视角的研究[D]. 北京: 商务部国际贸易经济合作研究院, 2018. [45] 尹慧, 李学迁. 环境政策调节下FDI引进质量与环境污染的相关性分析[J]. 经济研究导刊, 2018(33): 148-161. doi: 10.3969/j.issn.1673-291X.2018.33.055 [46] 金淳. 外商直接投资、经济发展水平与环境污染的关系——基于2003—2013年中国省际面板数据的经验研究[J]. 天津师范大学学报: 自然科学版, 2017(5): 75-80. doi: 10.3969/j.issn.1671-1114.2017.05.015 [47] 刘华军, 石印. 中国农业生态效率的空间分异与提升潜力[J]. 广东财经大学学报, 2020(6): 51-64. https://www.cnki.com.cn/Article/CJFDTOTAL-SONG202006006.htm -


 点击查看大图

图(5) / 表(8)
计量
- 文章访问数: 934
- HTML全文浏览量: 548
- PDF下载量: 30
- 被引次数: 0