

Between "Stabilizing Growth" and "Safeguarding Livelihoods": How Fiscal Pressure Alters Local Financial Expenditure
-
摘要: “稳增长”与“保民生”多重目标并存,地方政府如何在财政约束加剧的背景下调整财政支出结构是中国财政运行中的核心现实问题。结合地区异质性,分析不同类型财政压力下地方政府支出策略的调整机制,理论推导与实证研究结果表明:在经济环境变动引发的财政压力下,地方政府通常会削减生产性支出,且地区资本存量与既有生产性支出水平越低,调整幅度越大;转移性支出的变化方向具有不确定性,并随资本存量的提高可能由增加转为减少。在政策制度变动引发的财政压力下,生产性支出同样会出现收缩,且资本存量与既有生产性支出规模越大的地区,其收缩幅度越大;与此同时,转移性支出的削减程度随资本存量与资源禀赋的提高而显著增强。数值模拟结果再现了上述异质性调整路径,从而提升了实证结论的机制可信度。未来一段时期地方财政压力可能持续存在,本研究为理解“压力型”财政激励约束下的地方支出行为提供了分析框架。Abstract: With the dual objectives of stabilizing growth and safeguarding livelihoods, how local governments adjust fiscal expenditure structure under tightening budget constraints has become a central issue in China's fiscal governance. Incorporating regional heterogeneity, this study examines the adjustment mechanisms of local expenditure strategies under different types of fiscal pressure. Both theoretical derivations and empirical evidence show that, under fiscal pressure induced by changes in the economic environment, local governments tend to reduce productive expenditure, and the reduction is larger in regions with lower capital stock and lower pre-existing productive expenditure. The direction of changes in transfer expenditure is uncertain and may shift from increase to decrease as the capital stock rises. Under the fiscal pressure induced by policy and institutional changes, productive expenditure also contracts, and the contraction is greater in regions with larger capital stock and greater pre-existing productive expenditure. Meanwhile, cuts in transfer expenditure become more pronounced as the capital stock and resource endowments increase. Numerical simulations reproduce these heterogeneous adjustment paths within the theoretical framework, thereby strengthening the mechanism-based credibility of the empirical findings. As the fiscal pressure on local governments is likely to persist in the foreseeable future, this study provides an analytical framework for understanding local expenditure behavior under pressure-driven fiscal incentives and constraints.
-

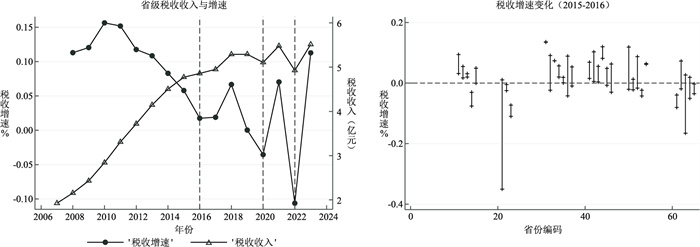
图 1 省级税收收入增速变化
注:左图为2007—2023年全国(按省汇总)税收收入与增速图,右图为2015—2016年全国省级税收收入增速变化图,竖线表示各省在2015与2016年的税收增速变化,竖线上方短横线表示2015年税收收入增速,竖线下方短横线表示2016年税收收入增速。以上数据以2007年为基期,采用GDP平减指数进行调整。

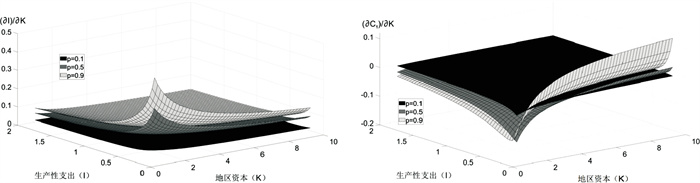
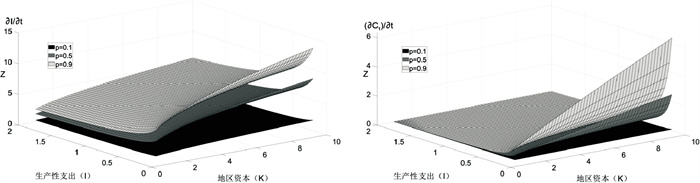
图 2 $\frac{\partial I}{\partial K} $(左图)与$\frac{\partial C_1}{\partial K} $(右图)
注:ρ=0.1、0.5、0.9分别代表不同的地区资源禀赋; 左图z轴为$\frac{\partial I}{\partial K} $,右图z轴为$\frac{\partial C_1}{\partial K} $。图 3同。
表 1 变量描述性统计
变量 含义 观测值 均值 标准差 最小值 最大值 被解释变量 I 生产性支出(亿元) 510 768.36 729.24 22.68 5 044.1 C1 转移性支出(亿元) 420 926.46 572.29 63.08 2 926.36 SecurExp 社会保障与就业支出(亿元) 510 653.93 481.63 25.50 2 440.04 HousExp 住房保障支出(亿元) 420 178.46 118.90 6.32 850.72 解释变量 tax 税收收入(亿元) 510 1 903.27 1 888.97 43.29 10 785.23 revenue 财政收入(亿元) 510 2 508.19 2 342.7 56.708 14 105.04 Impact1 经济环境引发的DD 480 0.000 0.013 -0.143 0.158 Impact2 政策变动引发的压力DD 480 -0.007 0.042 -0.295 0.287 Pgdp 人均GDP(元) 510 54 722.84 32 622.94 6 915 200 278 Urban 城市化水平(%) 510 58.098 13.321 28.24 89.6 Density 人口密度(人/平方公里) 510 462.093 686.982 7.64 3 926 IndStru 产业结构(%) 510 10.339 7.211 0.2 112 IncFdi 收入分权指标 510 0.335 0.124 0.162 0.721 ExpFdi 支出分权指标 510 0.481 0.086 0.339 0.737 Open 对外开放度(亿美元) 510 1 356.519 2 195.27 3.3 12 795.7 伴随变量 K 地区资本存量(万亿元) 510 4.564 3.741 0.193 21.077 I(t-1) 上期生产性支出(亿元) 480 705.132 636.803 22.674 4 827.379 注:价格相关的变量以2007年为基期,用GDP平减指数进行调整。数据来源于《中国统计年鉴》《中国财政年鉴》《中国固定资产投资统计年鉴》《中国固定资产投资领域统计年鉴》。  下载: 导出CSV
表 2 基准模型估计结果
变量 经济环境引起的财政压力 政策变动引起的财政压力 I C1 C1, adj I C1 C1, adj impact1 -1.433** 0.091 0.210 (-2.48) (0.51) (1.18) impact2 -1.492 0.672* 0.603* (-1.30) (1.94) (1.72) _cons -1.405 5.211*** 5.814*** -1.429 5.173*** 5.798*** (-0.60) (6.70) (8.14) (-0.61) (6.62) (8.11) 样本量 480 390 480 480 390 480 注: I列是生产性支出的估计结果,C1与C1, adj列是转移性支出的估计结果,其中C1中转移性支出为SecurExp+HousExp,C1, adj列中转移性支出为SecurExp。Impact1是经济环境引起的财政压力的强度DID变量,Impact2是政策变动引起的财政压力的强度DID变量。括号内为t值。***、**和*分别表示在1%、5%和10%的统计水平上显著。因篇幅所限,表2仅给出了核心变量估计结果,完整估计结果留存备索。
下载: 导出CSV
表 3 有限混合回归FMM模式数目判定
类别 模式数 对数似然值 AIC BIC CAIC AICC 模型分类 经济环境引发财政压力 生产性支出 1 -1 329.68 2 709 2 814 982 801 2 -1 101.99 2 310 2 531 960 743 3 -1 034.81 2 232 2 570 1 093 816 转移性支出 1 -852.719 1 751 1 844 1 911 1 769 2 -674.616 1 447 1 645 1 754 1 481 3 -598.145 1 346 1 649 1 858 1 466 政策变动引发财政压力 生产性支出 1 -1 329.62 2 709 2 814 2 868 2 721 2 -1 103.97 2 314 2 535 2 624 2 339 3 -1 044.11 2 250 2 588 2 696 2 284 转移性支出 1 -850.805 1 750 1 847 667 549 2 -678.223 1 456 1 658 699 489 3 -573.98 1 300 1 685 752 491 注:表中粗斜体显示的数值为四类模型中同一信息准则的最小值。
下载: 导出CSV
表 4 经济环境下行引起的财政压力
变量 I G 模式1 模式2 差异 模式1 模式2 差异 Impact1 -8.36*** -2.60** Wald=4.01 2.58* -12.97** Wald=8.80 (-2.86) (-2.09) P=0.045 (1.70) (-2.50) P=0.003 K 基准组 0.51 基准组 3.23*** (1.03) (5.53) It-1 基准组 0.27*** 基准组 -0.07** (3.63) (-2.08) 隶属概率 0.34 0.66 0.38 0.62 注:列I为生产性支出的估计结果,列C1为转移性支出的估计结果。Impact1是经济环境引起的财政压力的强度DID变量,K与It-1作为伴随变量,代表地区资本总额与上年度生产性支出总额。模式1和模式2为有限混合回归模型内生识别出的两类支出反应模式,编号本身不具有先验经济含义。模式1为基准组,括号内为t值。“差异”列是对两类模式系数差异的显著性检验结果,给出了Wald统计量。***、**和*分别表示在1%、5%和10%的统计水平上显著。下表同。
下载: 导出CSV
表 5 制度与政策变动引起的财政压力
变量 I C1 模式1 模式2 差异 模式1 模式2 差异 Impact2 -1.02 -55.11* Wald=2.69 14.54*** -75.54*** Wald=19.11 (-0.14) (-1.76) P=0.101 (3.17) (-3.76) P=0.000 K - 0.32 - 2.99*** (1.15) (4.51) It-1 - 0.14*** - 0.005 (4.02) (0.10) 隶属概率 0.73 0.27 0.37 0.63
下载: 导出CSV
表 6 经济环境下行引起的财政压力
变量 I C1 模式1 模式2 差异 模式1 模式2 差异 Impact1 -4.97 -1.23** Wald=0.071 6.47* -1.35 Wald=6.54 (-0.29) (-2.15) P=0.788 (1.07) (-0.39) P=0.046 K 基准组 0.53 基准组 7.42*** (1.03) (4.36) It-1 基准组 0.25*** 基准组 -0.18* (3.56) (-2.49)
下载: 导出CSV
表 7 制度与政策变动引起的财政压力
变量 I C1 模式1 模式2 差异 模式1 模式2 差异 Impact2 -3.14 -8.15** Wald=2.06 3.07 -24.39*** Wald=9.49 (-1.48) (-3.22) P=0.132 (0.81) (-4.39) P=0.002 K 基准组 0.15 基准组 2.83*** (0.47) (4.72) It-1 基准组 0.24*** 基准组 0.01 (3.79) (0.22)
下载: 导出CSV
表 8 联合DID估计结果
变量 I C1 模式1 模式2 差异 模式1 模式2 差异 Impact1 -3.45 -2.65** Wald=0.06 1.583 0.782* Wald=0.13 (-0.94) (-2.08) P=0.811 (0.75) (1.20) P=0.715 Impact2 -14.32*** -108.45*** Wald=10.50 14.10*** -77.66*** Wald=19.54 (-2.91) (-3.85) P=0.001 (3.04) (-3.83) P=0.000 K - 0.095 - 3.80*** (0.18) (3.11) It-1 - 0.005*** - -0.001 (3.76) (-1.50)
下载: 导出CSV
-
[1] 谢贞发, 彭鑫. 财政可持续能力: 定义、现实挑战与提升路径[J]. 财政研究, 2025(9): 17-32. [2] Mackay R C. The impact of fiscal stress on local government fiscal structures: an event study of the orange county bankruptcy[J]. Public Budgeting & Finance, 2017, 37(2): 102-124. [3] Thompson P N. Effects of fiscal stress labels on municipal government finances, housing prices, and the quality of public services: evidence from Ohio[J]. Regional Science and Urban Economics, 2017, 64(3): 98-116. [4] Skidmore M, Scorsone E. Causes and consequences of fiscal stress in Michigan cities[J]. Regional Science and Urban Economics, 2011, 41(4): 360-371. doi: 10.1016/j.regsciurbeco.2011.02.007 [5] Aikins S. Effects of intergovernmental revenue on local government draw on fiscal reserves: evidence from COVID-19 fiscal stress[J]. Local Government Studies, 2023, 35(6): 102-123. [6] Afonso A, Baxa J, Slavik M. Fiscal developments and financial stress: a threshold VAR analysis[J]. Empirical Economics, 2018, 54(2): 395-423. doi: 10.1007/s00181-016-1210-5 [7] Croix D, Delavallade C. Growth, public investment and corruption with failing institutions[J]. Economics of Governance, 2009, 10(3): 187-219. doi: 10.1007/s10101-008-0057-4 [8] Schweizer P, Juhola S. Navigating systemic risks: governance of and for systemic risks[J]. Global Sustainability, 2024, 7: 38-45. doi: 10.1017/sus.2024.30 [9] Jimenez B S. Fiscal stress and the allocation of expenditure responsibilities between state and local governments: an exploratory study[J]. State and Local Government Review, 2009, 41(2): 81-94. doi: 10.1177/0160323X0904100202 [10] Chung I H, Williams D. Local governments' responses to the fiscal stress label: the case of New York[J]. Local Government Studies, 2021, 47(5): 808-835. doi: 10.1080/03003930.2020.1797693 [11] 曹春方, 马连福, 沈小秀. 财政压力、晋升压力、官员任期与地方国企过度投资[J]. 经济学(季刊), 2014(3): 22-41. [12] 詹新宇, 王蓉蓉. 财政压力、支出结构与公共服务质量——基于中国229个地级市面板数据的实证分析[J]. 改革, 2022(2): 111-126. [13] 席鹏辉, 梁若冰, 谢贞发. 财政压力、产能过剩与供给侧改革[J]. 经济研究, 2017, 52(9): 86-102. [14] 吴敏, 周黎安. 财政压力的多层级传递与应对——基于取消农业税改革的研究[J]. 世界经济文汇, 2020(1): 41-59. [15] 余靖雯, 陈晓光, 龚六堂. 财政压力如何影响了县级政府公共服务供给?[J]. 金融研究, 2018(1): 18-35. [16] 李芳林, 胡志龙. 城市土地绿色利用、产业结构升级与财政压力[J]. 国土资源科技管理, 2026, 43(1): 77-90. [17] 徐超, 庞雨蒙, 刘迪. 地方财政压力与政府支出效率——基于所得税分享改革的准自然实验分析[J]. 经济研究, 2020, 55(6): 138-154. [18] 杨得前, 汪鼎. 财政压力、省以下政府策略选择与财政支出结构[J]. 财政研究, 2021(8): 47-62. [19] 孙开, 张磊. 分权程度省际差异、财政压力与基本公共服务支出偏向——以地方政府间权责安排为视角[J]. 财贸经济, 2019, 40(8): 18-32. [20] 周绍东, 艾欣. 国家治理视域下地方财政转型: 职能、取向与路径[J]. 经济与管理, 2025, 39(4): 1-11. [21] 祁毓, 廖嘉怡, 陈建伟, 等. 财政压力及其应对: 理论溯源、演化进展与研究启示[J]. 财政研究, 2023(4): 3-17. [22] 吕冰洋, 胡深. 中国央地财政关系的演进: 一个理论框架[J]. 经济研究, 2024, 59(6): 69-87. [23] Cai H, Treisman D. Does competition for capital discipline governments? decentralization, globalization, and public policy[J]. American Economic Review, 2005, 95(3): 817-830. doi: 10.1257/0002828054201314 [24] 单豪杰. 中国资本存量K的再估算: 1952~2006年[J]. 数量经济技术经济研究, 2008, 25(10): 17-31. [25] 赵志耘, 刘晓路, 吕冰洋. 中国要素产出弹性估计[J]. 经济理论与经济管理, 2006(6): 5-11. [26] 卞志村, 杨源源. 结构性财政调控与新常态下财政工具选择[J]. 经济研究, 2016, 51(3): 66-80. [27] 王立勇, 纪尧. 财政政策波动性与财政规则: 基于开放条件DSGE模型的分析[J]. 经济研究, 2019, 54(6): 121-135. [28] Angrist J D, Pischke J S. Mastering 'metrics: The path from cause to effect[M]. Princeton, NJ: Princeton University Press, 2014. -

 点击查看大图
计量
- 文章访问数: 13
- HTML全文浏览量: 13
- PDF下载量: 1
- 被引次数: 0