On the Spatial Effect of Competition of Environmental Protection Expenditure in Local Government
-
摘要: 中国式财政分权为地方政府的财政支出竞争创造了可能。基于策略互动的视角,使用30个省级地区2007—2016年的面板数据,采用莫兰指数、局部莫兰指数和空间杜宾模型方法,实证检验了地方政府间环境保护支出竞争的存在,以及环境保护支出竞争对环境污染的空间效应。研究结果表明:地方政府在环境保护支出方面存在竞争,环境保护已不再像其他非经济性公共品一样容易被地方政府忽视,地方政府间的环境保护支出竞争为策略模仿行为;同时,环境保护支出竞争存在空间溢出效应。进一步分析发现,地理相邻的地方政府间的环境保护支出有利于降低本地区的污染物排放。由此,改变政绩考核机制,加大环保支出、优化产业结构、降低污染排放、充分利用市场机制及公众参与环保监督、探索地方政府环境污染区域协调治理方式是改善环境状况的重要政策选择。Abstract: China-style fiscal decentralization has created the possibility for local governments to compete in financial expenditure. Based on the panel data of 30 provincial-level regions in mainland China from 2007 to 2016, and from the perspective of strategic interaction combined with the Moran index, local Moran index and spatial panel model, the paper empirically tests the existence of competition of environmental protection expenditure among local governments and the spatial effect of competition of environmental protection expenditure on environmental pollution. The results show that there is competition among local governments in environmental protection expenditure, which belongs to strategy imitation; at the same time, the competition of environmental protection expenditure has spill-over effect. Further analysis shows that local governments' environmental protection expenditure in adjacent spaces is conducive to reducing pollutant emissions in the region. Therefore, it is an important policy choice to change the performance appraisal mechanism so as to increase environmental protection expenditure, optimize the upgrading of industrial structure and reduce pollution emissions, make full use of market mechanism and public participation in environmental protection supervision, and explore the coordinated regional governance mode for environmental pollution.
-
表 1 主要变量名称及定义
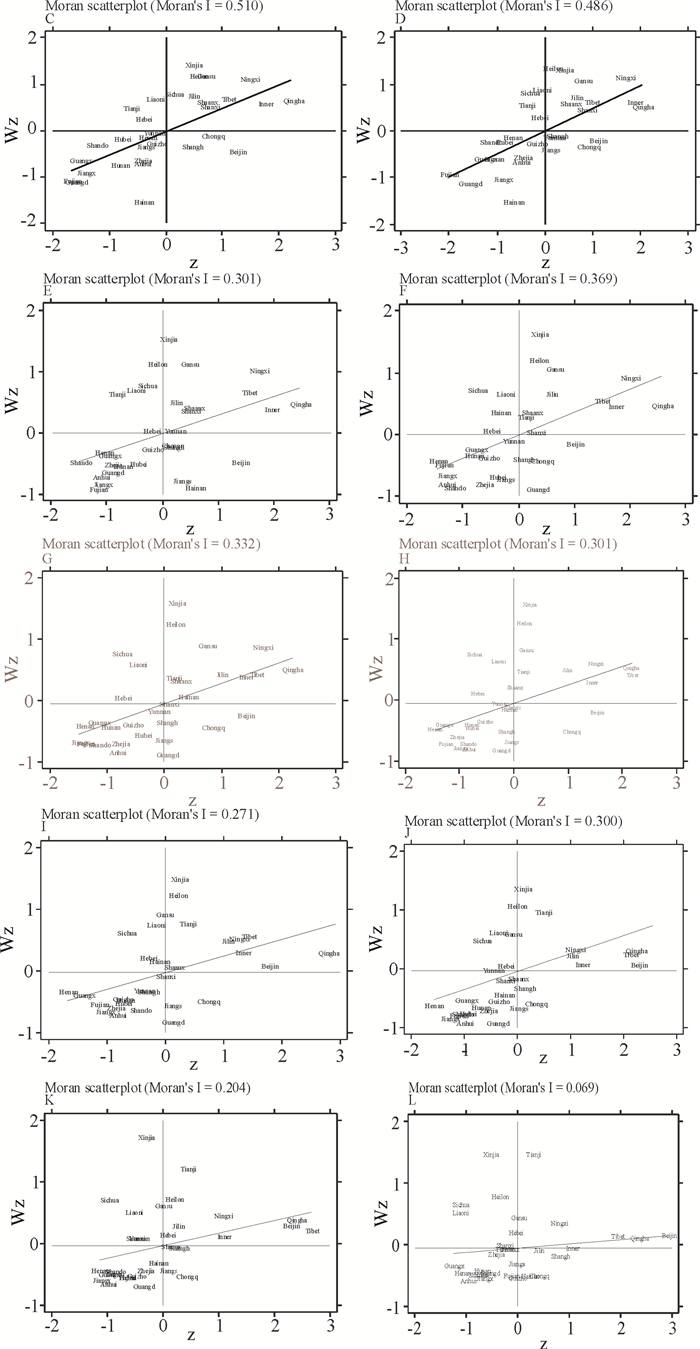
变量名称 变量表示形式 变量定义 被解释变量 工业二氧化硫排放量 SO2 报告期内企业燃料燃烧和生产工艺过程中排入大气的二氧化硫总量的对数 工业废水排放量 water 报告期内经过企业厂区所有排放口排到企业外部的工业废水总量的对数 工业烟(粉)尘排放量 smoke 报告期内企业在生产工艺过程中排放的颗粒物(烟粉尘)总重量的对数 解释变量 人均环境保护支出 ex 各省环境保护支出/各省人口 地方政府经济发展水平 rgdp 各省级地区的GDP /该地区年末总人口数,取对数 城镇化水平 urban 各省级地区城镇人口占总人口的比重 技术水平 tc 各省级地区万吨标准煤/该省级地区GDP 贸易开放度 open 各省级地区进出口贸易总额占GDP的比重 社会固定资产投资 asset 各省级地区社会固定资产投资额的对数 产业结构水平 is 各省级地区第二产业增加值占GDP的比重 表 2 2007—2016年人均环保支出莫兰指数检测结果
Variables | Ⅰ E(Ⅰ) sd(Ⅰ) z p-value* 2007 | 0.510 -0.033 0.119 4.567 0.000 2008 | 0.486 -0.033 0.119 4.372 0.000 2009 | 0.301 -0.033 0.118 2.830 0.002 2010 | 0.369 -0.033 0.117 3.429 0.000 2011 | 0.332 -0.033 0.119 3.064 0.001 2012 | 0.301 -0.033 0.118 2.820 0.002 2013 | 0.271 -0.033 0.116 2.624 0.004 2014 | 0.300 -0.033 0.117 2.849 0.002 2015 | 0.204 -0.033 0.115 2.057 0.020 2016 | 0.069 -0.033 0.115 0.891 0.186 表 3 2017—2016年工业废水排放量莫兰指数检测结果
Variables | Ⅰ E(Ⅰ) sd(Ⅰ) z p-value* 0.015 2007 | 0.217 -0.033 0.115 2.170 0.018 2008 | 0.210 -0.033 0.115 2.105 0.011 2009 | 0.231 -0.033 0.115 2.303 0.013 2010 | 0.220 -0.033 0.114 2.221 0.012 2011 | 0.213 -0.033 0.109 2.268 0.011 2012 | 0.214 -0.033 0.108 2.301 0.012 2013 | 0.211 -0.033 0.108 2.265 0.009 2014 | 0.219 -0.033 0.107 2.351 0.009 2015 | 0.225 -0.033 0.108 2.384 0.039 2016 | 0.168 -0.033 0.114 1.762 表 4 全国空间动态面板杜宾模型检测结果
(1) (2) (3) Wx — — — x -4.384***(-23.21) -0.017 6(-0.09) 0.173(0.91) 人均GDP -39.89***(-39.36) -1.446(-1.37) 0.262(0.26) 城镇化水平 353.1***(94.34) -0.149(-0.04) 20.36***(5.35) 技术水平 1.650***(3.67) 0.386(0.74) 2.560***(5.12) 贸易开放度 -9.130***(-20.07) 0.155(0.33) -0.993*(-2.18) 社会固定资产投资 -13.81***(-39.53) 0.613(1.69) 0.141(0.40) 产业结构水平 180.3***(77.93) -0.373(-0.15) 5.815*(2.49) Spatial rho 2.065***(27.21) 0.403***(5.12) 0.393***(5.08) Variance sigma2_e 0.047 0***(8.52) 0.077 7***(12.88) 0.071 3***(12.93) 注:采用stata14整理得出,括号内为t值。*p < 0.05, **p < 0.01, ***p < 0.001 -
[1] 李涛, 周业安. 财政分权视角下的支出竞争和中国经济增长: 基于中国省级面板数据的经验研究[J]. 世界经济, 2008(11): 3-15. doi: 10.3969/j.issn.1002-9621.2008.11.001 [2] 郭庆旺, 贾俊雪. 地方政府间策略互动行为、财政支出竞争与地区经济增长[J]. 管理世界, 2009(10): 17-27, 187. https://www.cnki.com.cn/Article/CJFDTOTAL-GLSJ200910005.htm [3] 才国伟, 钱金保. 中国地方政府的财政支出与财政效率竞争[J]. 统计研究, 2011(10): 36-46. doi: 10.3969/j.issn.1002-4565.2011.10.006 [4] CASE A, HINES J, ROSE H. Budget spillover and fiscal policy interdependence: evidence from the states[J]. Journal of Public Economics, 1993, 52(3): 285-307. doi: 10.1016/0047-2727(93)90036-S [5] BAICKER K. The spillover effects of state spending[J]. Journal of Public Economics, 2005, 89(2): 529-544. http://www.sciencedirect.com/science/article/pii/S0047272704000118 [6] LUNDBERG J. Spatial interaction model of spillover from locally provided public services[J]. Regional Studies, 2006, 40(6): 634-644. [7] 张征宇, 朱平芳. 地方环境支出的实证研究[J]. 经济研究, 2010(10): 82-94. https://www.cnki.com.cn/Article/CJFDTOTAL-JJYJ201005007.htm [8] 赵宵伟. 地方政府间环境规制竞争策略及其地区增长效应[J]. 财贸经济, 2014(10): 105-113. https://www.cnki.com.cn/Article/CJFDTOTAL-CMJJ201410011.htm [9] 李胜兰, 初善冰, 申晨. 地方政府竞争、环境规制与区域生态效率[J]. 世界经济, 2014(4): 88-110. https://www.cnki.com.cn/Article/CJFDTOTAL-SJJJ201404006.htm [10] 王亚菲. 公共财政环保投入对环境污染的影响分析[J]. 财政研究, 2011(2): 38-42. https://www.cnki.com.cn/Article/CJFDTOTAL-CZYJ201102010.htm [11] 田淑英, 董玮, 许文立. 环保财政支出、政府环境偏好与政策效应——基于省际工业污染数据的实证分析[J]. 经济问题探索, 2016(7): 14-21. https://www.cnki.com.cn/Article/CJFDTOTAL-JJWS201607004.htm [12] 黄珺, 余朝晖. 环境治理投资与财政环保支出对环境污染的影响——基于面板模型的比较分析[J]. 生态经济, 2018(7): 83-87. https://www.cnki.com.cn/Article/CJFDTOTAL-STJJ201807016.htm [13] 臧传琴, 陈蒙. 财政环境保护支出效应分析——基于2007—2015年中国30个省份的面板数据[J]. 财经科学, 2018(6): 68-79. https://www.cnki.com.cn/Article/CJFDTOTAL-CJKX201806007.htm [14] 李志美, 雷良海. 地方政府节能环保支出环境效应研究[J]. 北京邮电大学学报: 社会科学版, 2018(6): 89-96. https://www.cnki.com.cn/Article/CJFDTOTAL-BJYS201806011.htm [15] 赵超, 郑君君, 何鸿勇. 我国经济增长对环境污染影响的空间计量研究[J]. 统计与决策, 2015(23): 123-126. https://www.cnki.com.cn/Article/CJFDTOTAL-TJJC201523036.htm [16] 谭志雄, 张阳阳. 财政分权与环境污染关系实证研究[J]. 中国人口·资源与环境, 2015(4): 110-117. https://www.cnki.com.cn/Article/CJFDTOTAL-ZGRZ201504014.htm [17] 游达明, 张杨, 袁宝龙. 官员晋升锦标赛体制下环境规制、央地分权对环境污染的影响研究[J]. 中南大学学报: 社会科学版, 2018(3): 71-82. https://www.cnki.com.cn/Article/CJFDTOTAL-ZLXS201803009.htm [18] CLIFF A C, ORD J K. Spatial auto correlation[M]. London: Pion Limited, 1973: 23-49. [19] 余英, 范心平. 地方政府科技支出策略互动及对科技进步的影响——以广东为例[J]. 地方财政研究, 2018(2): 55-66. https://www.cnki.com.cn/Article/CJFDTOTAL-DFCZ201802010.htm [20] ANSELIN L. Local indicators of spatial association—LISA[J]. Geographical Analysis, 2010, 27(2): 93-115. http://www.tandfonline.com/servlet/linkout?suffix=CIT0003&dbid=16&doi=10.1080%2F00330124.2013.784953&key=10.1111%2Fj.1538-4632.1995.tb00338.x -


 下载:
下载:


