

The Growth Sources, Existing Potential and the Future Growth Interval in China's Economy
-
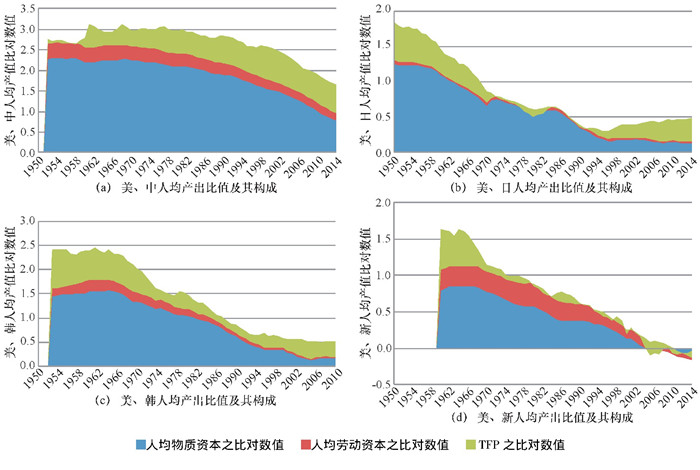
摘要: 基于中美日等经济体1950—2017年的投入产出数据, 研究其经济增长之源, 进而识别中国经济的追赶动力, 并预测未来的经济增长区间。研究结果表明:物质要素积累、劳动质量提升以及潜在增长空间支撑了中国经济增长的韧性; 1980—2014年间的经济增长主要得益于物质资本和TFP的贡献, 贡献率分别为43. 5%和41%;人均收入水平、生产率、要素价格等与美国相距较远, 但未来的经济发展仍存在较大增长空间, 基于增长外推法的实证分析表明, 中国在2018—2023年和2023—2028年的GDP增长率将分别落在6%~7%、5%~6%之间。Abstract: Based on the data of inputs and outputs of China, the United States, Japan and several other economies during 1950-2017, this paper examines the power of the Chinese catching up in the past through analyzing the sources of economic growth for sample economies, to predict potential economic growth interval of China. The empirical results show that the accumulation of material factors, the improvement of labor quality and the potential growth space maintain the resilience of China's economic growth; the economic growth of China is mainly due to the"contribution"of physical capital and TFP during 1980-2014, with the contribution rate of 43. 5% and 41% respectively; as to the level of China's per capital income, productivity, factor price and other aspects, China is far away from the United States, but there is still a large growth space for economic development in the future. Empirical analysis based on growth extrapolation indicates that China's GDP growth rate in 2018-2023 and 2023-2028 will still maintain 6%-7% and 5%-6% respectively.
-
Key words:
- China's economy /
- economic growth /
- GDP /
- income level /
- labor productivity /
- factor price
-

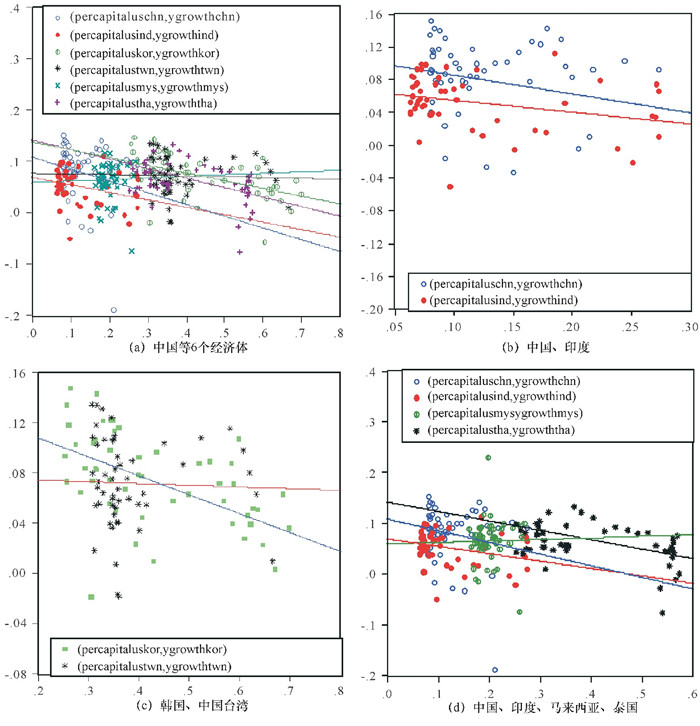
图 3 GDP增长率(纵轴)与各经济体人均资本/美国人均资本(横轴)的散点图
注:percapitaluschn表示中国人均资本/美国人均资本,percapitalusind表示印度人均资本/美国人均资本,percapitaluskor表示韩国人均资本/美国人均资本,percapitalustwn表示中国台湾人均资本/美国人均资本,percapitalusmys表示马来西亚人均资本/美国人均资本,percapitalustha表示泰国人均资本/美国人均资本,ygrowthchn、ygrowthind、ygrowthkor、ygrowthtwn、ygrowthmys、ygrowththa分别表示中国、印度、韩国、中国台湾、马来西亚及泰国的人均GDP增长率; 数据来源于PWT9.0。

图 4 GDP增长率(纵轴)与各经济体人均GDP/美国人均GDP(横轴)的散点图
注:pergdpuschn代表中国人均GDP/美国人均GDP, pergdpusind代表印度人均GDP/美国人均GDP, pergdpuskor代表韩国人均GDP/美国人均GDP, pergdpustwn代表中国台湾人均GDP/美国人均GDP, pergdpusmys代表马来西亚人均GDP/美国人均GDP, pergdpustha代表泰国人均GDP/美国人均GDP; ygrowthchn、ygrowthind、ygrowthkor、ygrowthtwn、ygrowthmys、ygrowththa分别表示中国、印度、韩国、中国台湾、马来西亚及泰国的人均GDP增长率; 数据来源于PWT9.0。

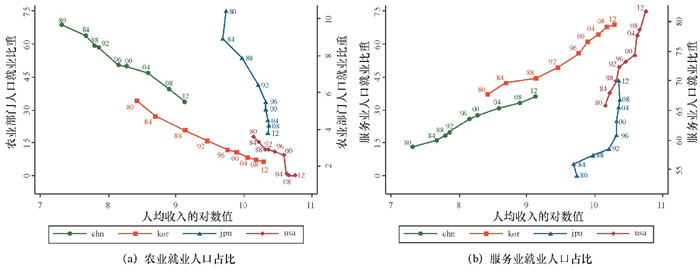
图 5 1980—2012年中、韩、日、美四国的农业及服务业就业人口占比趋势图
注:数据来源于World Bank Online(2017);横轴中的人均收入按2005年美元计。
表 1 1960—2011年各经济体的α值对比
时期 中国 印度 韩国 马来西亚 泰国 中国台湾 1960—1970 0.453 5 0.282 1 0.370 8 0.460 8 0.522 9 0.453 8 1971—1980 0.452 1 0.311 7 0.403 3 0.464 7 0.563 5 0.456 5 1981—1990 0.450 7 0.341 2 0.435 9 0.468 7 0.607 8 0.458 7 1991—2000 0.456 5 0.365 8 0.451 6 0.469 3 0.608 8 0.464 5 2001—2011 0.462 2 0.384 7 0.467 4 0.469 9 0.609 9 0.461 3 1960—2011 0.465 3 0.337 1 0.425 8 0.466 6 0.582 9 0.458 0  下载: 导出CSV
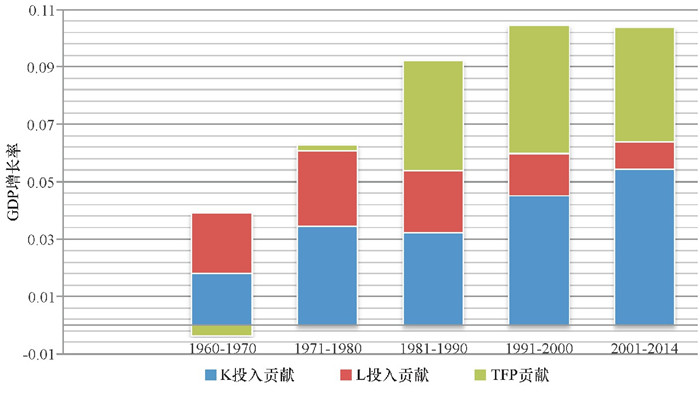
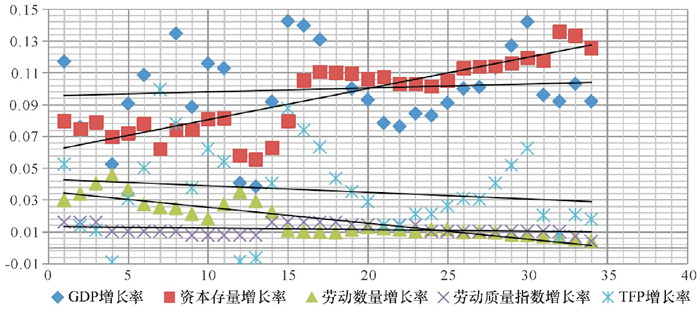
表 2 1960—2014年我国经济增长的动力源泉分析
国家和地区 1960—1970年 1971—1980年 GDP增长率(%) 增长源泉(%) GDP增长率(%) 增长源泉(%) 资本投入 劳动投入 TFP 资本投入 劳动投入 TFP 总计 工作时数 劳动质量 总计 工作时数 劳动质量 中国 3.52 1.81 2.10 1.37 0.74 -0.39 6.11 3.46 2.63 1.80 0.83 0.02 印度 4.11 1.13 0.96 0.55 0.41 2.02 2.67 1.10 3.01 2.27 0.74 -1.44 韩国 7.17 2.38 3.18 2.00 1.18 1.61 10.27 3.51 3.76 2.53 1.22 3.00 马来西亚 5.65 1.76 2.27 1.41 0.86 1.63 9.83 4.67 2.80 1.95 0.85 2.36 泰国 10.19 4.57 0.77 1.07 -0.30 4.85 7.01 4.79 1.38 0.95 0.43 0.84 中国台湾 8.63 4.08 2.10 1.52 0.57 2.46 10.06 6.28 3.13 2.30 0.83 0.65 均值 6.55 2.62 1.90 1.32 0.58 2.03 7.66 3.97 2.79 1.97 0.82 0.91 国家和地区 1980—1990年 1991—2000年 GDP增长率(%) 增长源泉(%) GDP增长率(%) 增长源泉(%) 资本投入 劳动投入 TFP 资本投入 劳动投入 TFP 总计 工作时数 劳动质量 总计 工作时数 劳动质量 中国 9.20 3.22 2.17 1.65 0.52 3.82 10.46 4.50 1.48 0.83 0.66 4.48 印度 5.94 1.54 2.76 1.80 0.96 1.63 5.49 1.91 1.91 1.27 0.64 1.68 韩国 8.68 4.76 2.04 1.59 0.45 1.88 6.63 4.75 1.45 0.79 0.66 0.43 马来西亚 6.07 4.12 2.60 1.91 0.69 -0.65 7.23 4.55 2.70 1.74 0.96 -0.02 泰国 7.61 4.80 1.83 1.41 0.43 0.98 4.69 4.50 0.39 0.13 0.26 -0.20 中国台湾 7.62 4.54 1.84 1.31 0.53 1.24 6.24 4.42 1.23 0.74 0.49 0.59 均值 7.52 3.83 2.21 1.61 0.60 1.48 6.79 4.10 1.53 0.89 0.64 1.16 国家和地区 2001—2014年 韩、台、马、泰(1960—2014);中、印(1980—2014) GDP增长率(%) 增长源泉(%) GDP增长率(%) 增长源泉(%) 资本投入 劳动投入 TFP 资本投入 劳动投入 TFP 总计 工作时数 劳动质量 总计 工作时数 劳动质量 中国 10.36 5.44 0.94 0.44 0.50 3.98 10.01 4.39 1.53 0.91 0.62 4.09 印度 7.50 3.61 1.90 1.30 0.60 2.00 6.31 2.35 2.19 1.46 0.73 1.77 韩国 4.12 2.56 1.04 0.72 0.32 0.52 7.28 3.57 2.25 1.50 0.75 1.45 马来西亚 4.66 2.21 1.67 1.29 0.38 0.78 6.56 3.39 2.39 1.65 0.74 0.78 泰国 4.16 1.65 1.32 0.82 0.51 1.19 6.76 4.02 1.15 0.89 0.26 1.59 中国台湾 3.94 1.79 1.05 0.60 0.45 1.10 7.21 4.14 1.83 1.27 0.57 1.24 均值 5.79 2.88 1.32 0.86 0.46 1.59 7.36 3.64 1.89 1.28 0.61 1.82
下载: 导出CSV
表 3 对中国2018—2023年、2023—2028年的潜在经济增长预测
% 变量值 A实际增长率 1981—1990年 1991—2000年 2001—2010年 2011—2017年 1980—2017年 ΔlnY 9.20 10.46 10.36 7.57 9.40 ΔlnK 3.22 4.50 5.44 3.53 4.17 ΔlnH 1.65 0.83 0.44 0.32 0.81 Δlnh 0.52 0.66 0.50 0.70 0.60 TFP 3.82 4.48 3.98 3.02 3.83 变量值 B预期增长率 2018—2023年 2023—2028年 乐观值 悲观值 基准值 乐观值 悲观值 基准值 ΔlnY 7.53 6.67 7.08 5.67 5.02 5.33 ΔlnH 0.34 0.22 0.32 0.26 0.17 0.24 Δlny 7.19 6.45 6.76 5.41 4.85 5.09 变量值 C预期增长率(增长外推法) D预期增长率(回归中值法) 2018—2028年 2018—2028年 ΔlnY 6.67 2.00 注:ΔlnY、ΔlnK、ΔlnH、Δlnh、Δlny分别表示产出、资本、劳动数量、人力资本质量及劳动生产率的增长率。
下载: 导出CSV
-
[1] BRANDT LOREN, T TOMBE, XIAODONG ZHU. Factor market distortions across time, space and sectors in China[J]. Review of economic dynamics, 2013, 16(1): 39-58. doi: 10.1016/j.red.2012.10.002 [2] 林毅夫.中国经济未来20年有望达到8%年均增长[EB/OL]. (2012-08-10)[2012-08-11]. http://finance.21cn.com/newsdoc/zx/2012/08/11/12642238.shtml. [3] 张军, 徐力恒, 刘芳.鉴往知来:推测中国经济增长潜力与结构演变[J].世界经济, 2016(1): 52-74. https://www.cnki.com.cn/Article/CJFDTOTAL-SJJJ201601004.htm [4] PRITCHETT LANT, SUMMERS LAWRENCE. Asiaphoria meets regression to the mean[R]. Cambridge: NBER Working Paper, No. 20573, 2014. [5] SACHS J, RADELET S, LEE J-W. Determinants and prospects of economic growth in Asia[J]. International economic journal, 2001, 15(3): 1-29. http://www.mysciencework.com/publication/show/a5b4b73c40b9062ed4310adb4079b52a [6] LEE JONG-WHA, HONG KISEOK. Economic growth in asia: determinants and prospects[R]. ADB Economics Working Paper Series 220, A-sian Development Bank, 2010. [7] GERTZ B. The China threat how the people's republic targets America[M]. Washington D. C. : Regnery Publishing, 2000. [8] TIMPERLAKE E, TRIPLETT W C JR. Red dragon rising: communist China's military threat to America[M]. Washington D. C. : Regnery Publishing, 2002. [9] MURRAY G. China: the next superpower: dilemmas in change and continuity[M]. Richmond: China Library(Curzon Press), 1998. [10] DOUGLAS A. Meet the new China[J]. International journal of business, 2002, 7(3): 35-49. http://www.questia.com/read/1G1-175523798/meet-the-new-china [11] QIAN YINGYI. How reform worked in China[M]∥D RODRIK. Search of prosperity: analytic narratives on economic growth. Princeton NJ: Princeton University Press, 2003: 297-333. [12] WOO W T. The real reasons for China's growth[J]. The China journal, 1999, 41(1): 115-137. [13] LIN JUSTIN YIFU, CAI FANG, LI ZHOU. The China miracle: development strategy and economic reform(revised edition)[M]. Hong Kong: The Chinese University Press, 2003. [14] WANG YAN, YAO YUDONG. Sources of China's economic growth 1952-1999: incorporating human capital accumulation[J]. China economic review, 2003, 14(1): 32-52. doi: 10.1016/S1043-951X(02)00084-6 [15] YOUNG A. Gold into base metals: productivitygrowth in the People's Republic of China during the reform period[J]. Journal of political economy, 2003, 111(6): 1220-1261. doi: 10.1086/378532 [16] CHOW G, LI K-W. China's economic growth 1952-2010[J]. Economic development and cultural change, 2002, 51(1): 247-256. doi: 10.1086/344158 [17] HOLZ C A. China's economic growth 1978-2025: what we know today about China's economic growth tomorrow[J]. World development, 2008, 36(10): 1665-1691. doi: 10.1016/j.worlddev.2007.09.013 [18] PERKINS DWIGHT H, THOMAS G RAWSKI. Forecasting China's economic growth to 2025[M]∥China's great economic transformation. Cambridge University Press, 2008: 829-886. [19] JORGENSON D W. Designing a new architecture for the U. S. national accounts to capture innovation[J]. Survey of current business, 2010, 90(2): 17-23. http://search.ebscohost.com/login.aspx?direct=true&db=buh&AN=48881703&site=ehost-live [20] HALL ROBERT E, CHARLES I JONES. Why do some countries produce so much more output per worker than others?[J]. Quarterly journal of economics, 1999, 114(1): 83-116. doi: 10.1162/003355399555954 [21] LEE J-W. Korea's economic growth and catch-up: implications for China[J]. China world economy, 2016, 24(5): 71-97. doi: 10.1111/cwe.12175 [22] HSIEH CHANG-TAI, PETER J KLENOW. Misallocation and manufacturing TFP in China and India[J]. Quarterly journal of economics, 2009, 74(4): 1403-1448. http://qje.oxfordjournals.org/content/124/4/1403 [23] SONG ZHENG(MICHAEL), WU GUIYING(LAYRA). A structural estimation on capital market distortions in Chinese manufacturing[R]. Singapore: Economic Growth Centre Working Paper Series 1306, Nanyang Technological University, School of Humanities and Social Sciences, Economic Growth Centre, 2013. [24] KUZNETS S. Economic growth and the contribution of agriculture: notes on measurement, international[J]. Journal of agrarian affairs, 1961, 3(2): 55-75. http://ageconsearch.umn.edu/handle/209625 [25] BARRO R J, SALA-I-MARTIN X. Technological diffusion, convergence, and growth[J]. Journal of economic growth, 1997, 2(1): 1-26. doi: 10.1023/A:1009746629269 [26] TEMPLE J, WÖMANN L. Dualism and cross-country growth regressions[J]. Journal of economic growth, 2006, 11(3): 187-228. doi: 10.1007/s10887-006-9003-x [27] BOSWORTH BARRY, SUSAN M COLLINS. Accounting for growth: comparing China and India[J]. Journal of economic perspectives, 2008, 22(1): 45-66. doi: 10.1257/jep.22.1.45 [28] GREENWOOD J, UYSAL G. New goods and the transition to a new economy[J]. Journal of economic growth, 2005, 10(2): 99-134. doi: 10.1007/s10887-005-1668-z [29] DING S, KNIGHT J. Can the augmented solow model explain China's remarkable economic growth?a cross-country panel data analysis[J]. Journal of comparative economics, 2009, 37(3): 432-452. doi: 10.1016/j.jce.2009.04.006 [30] ZHU XIAODONG. Understanding China's growth: past, present, and future[J]. Journal of economic perspectives, 2012, 26(4): 103-124. doi: 10.1257/jep.26.4.103 -


 点击查看大图
计量
- 文章访问数: 304
- HTML全文浏览量: 161
- PDF下载量: 15
- 被引次数: 0